The Illusory Dunning-Kruger Effect and Reciprocal Fits
Published on Sun 27 September 2026
The Dunning–Kruger (DK) effect states that people with low skill tend to overestimate their ability, while those with high skill tend to underestimate theirs. Though intuitive, the central evidence in the original DK paper [1] was famously invalid — its analysis produces the same pattern even when participant predictions are completely unbiased. Previous "post-mortems" of the paper have focused on regression to the mean and a global positive bias in predictions [2,3]. Here, we don't address whether the effect is real, but instead focus on the logical flaw in the original analysis. We show that it stemmed from a common mistake: forgetting that regressing \(y\) on \(x\) generally gives a different slope from regressing \(x\) on \(y\).
The Dunning-Kruger plot
The original DK paper considered an experiment where study participants were first asked to predict their future performance on some specified task. Next, the participants performed the task and had their results graded. The participants were then binned according to their actual performance into four quartile groups. Plotting the self-predicted performance against the actual performance across these groups generated a plot as in the black curve in Figure 1 below. The red points there show the \(y=x\) line for comparison. Notice that the top performing quartile underpredicted their average performance, while the bottom performing quartile overpredicted theirs.
At first glance, this result does seem to suggest that the talented underestimate their skill and vice versa. But in fact, I generated this plot using a simulated data set where each participant's estimate was completely unbiased. How can this be?
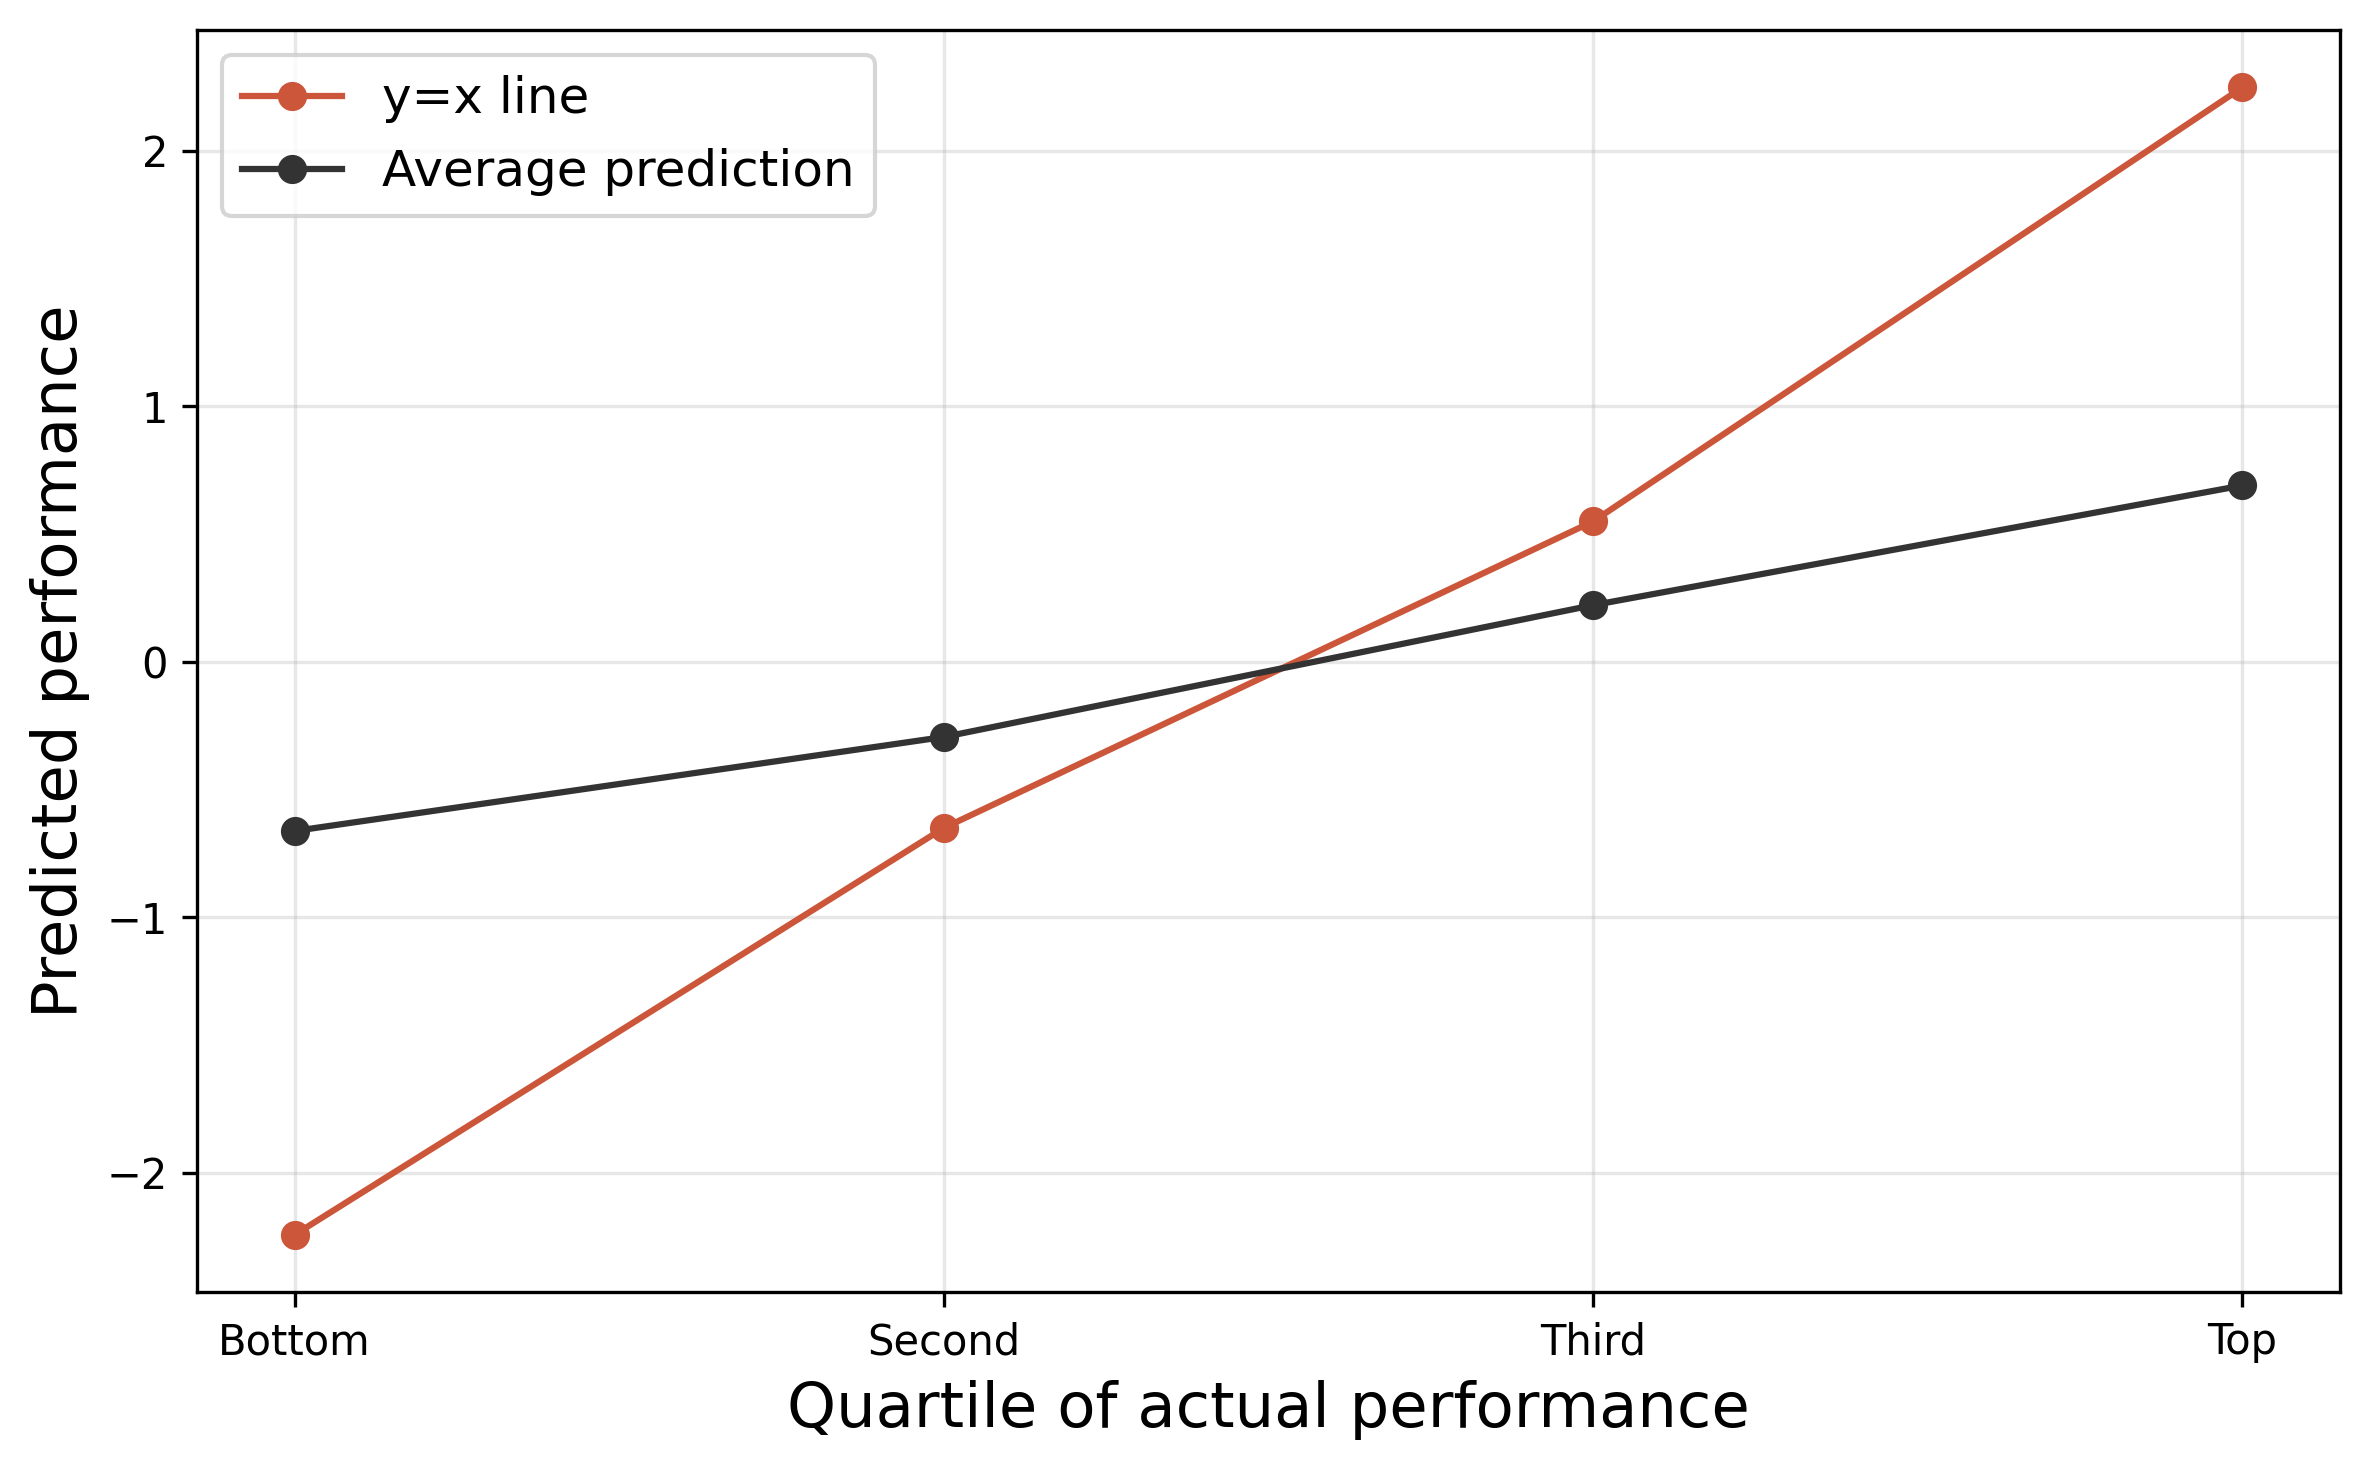
Figure 1: DK-type plot, showing predicted performance vs actual performance. The black curve shows that those who performed best (top quartile) underestimated how well they'd do, etc.
Explanation in terms of reciprocal fit slopes
Suppose we generate simulated \((x_i, y_i)\) data via the linear relationship
where \(m\) is a parameter that relates the performance level of each participant to their prediction, and \(\epsilon_i\) is IID \(N(0,\sigma^2)\) noise on top of that. For convenience, further suppose we have centered and normalized the \(x_i\) to have mean \(0\) and variance \(1\).
Using standard formulas for the least-squares fit line, the slope of the fit of \(y\) vs \(x\) is given by
Here, we've used (\ref{model}) to evaluate the numerator. Similarly, when we regress \(x\) on \(y\), the slope is
Notice that if \(\sigma^2 > 0\), (\ref{myx}) and (\ref{mxy}) are not reciprocals. If we plot both fit lines on a fixed set of axes they will differ.
We can now understand the illusory DK effect in terms of the two slopes (\ref{myx}) and (\ref{mxy}): If we set \(m=1\) in (\ref{model}), we have \(y_i = x_i + \epsilon_i\). Averaging performance at fixed prediction gives \(E(y \vert x) = x\) — no bias. This is what we'd see by plotting \(y\) vs \(x\), reading out the slope \(m_{y \vert x} = 1\), as in Figure 2. But the black DK line in Figure 1 is a plot of \(x\) vs \(y\), having slope \(m_{x \vert y} = \frac{1}{1+\sigma^2} < 1\). Therefore, while the DK plot does show that the top-performing group had, on average, predicted scores below their realized scores — it does not show that any group had systematic bias in their performance predictions. A tongue-twister, perhaps, but these are different assertions corresponding to two different regressions.
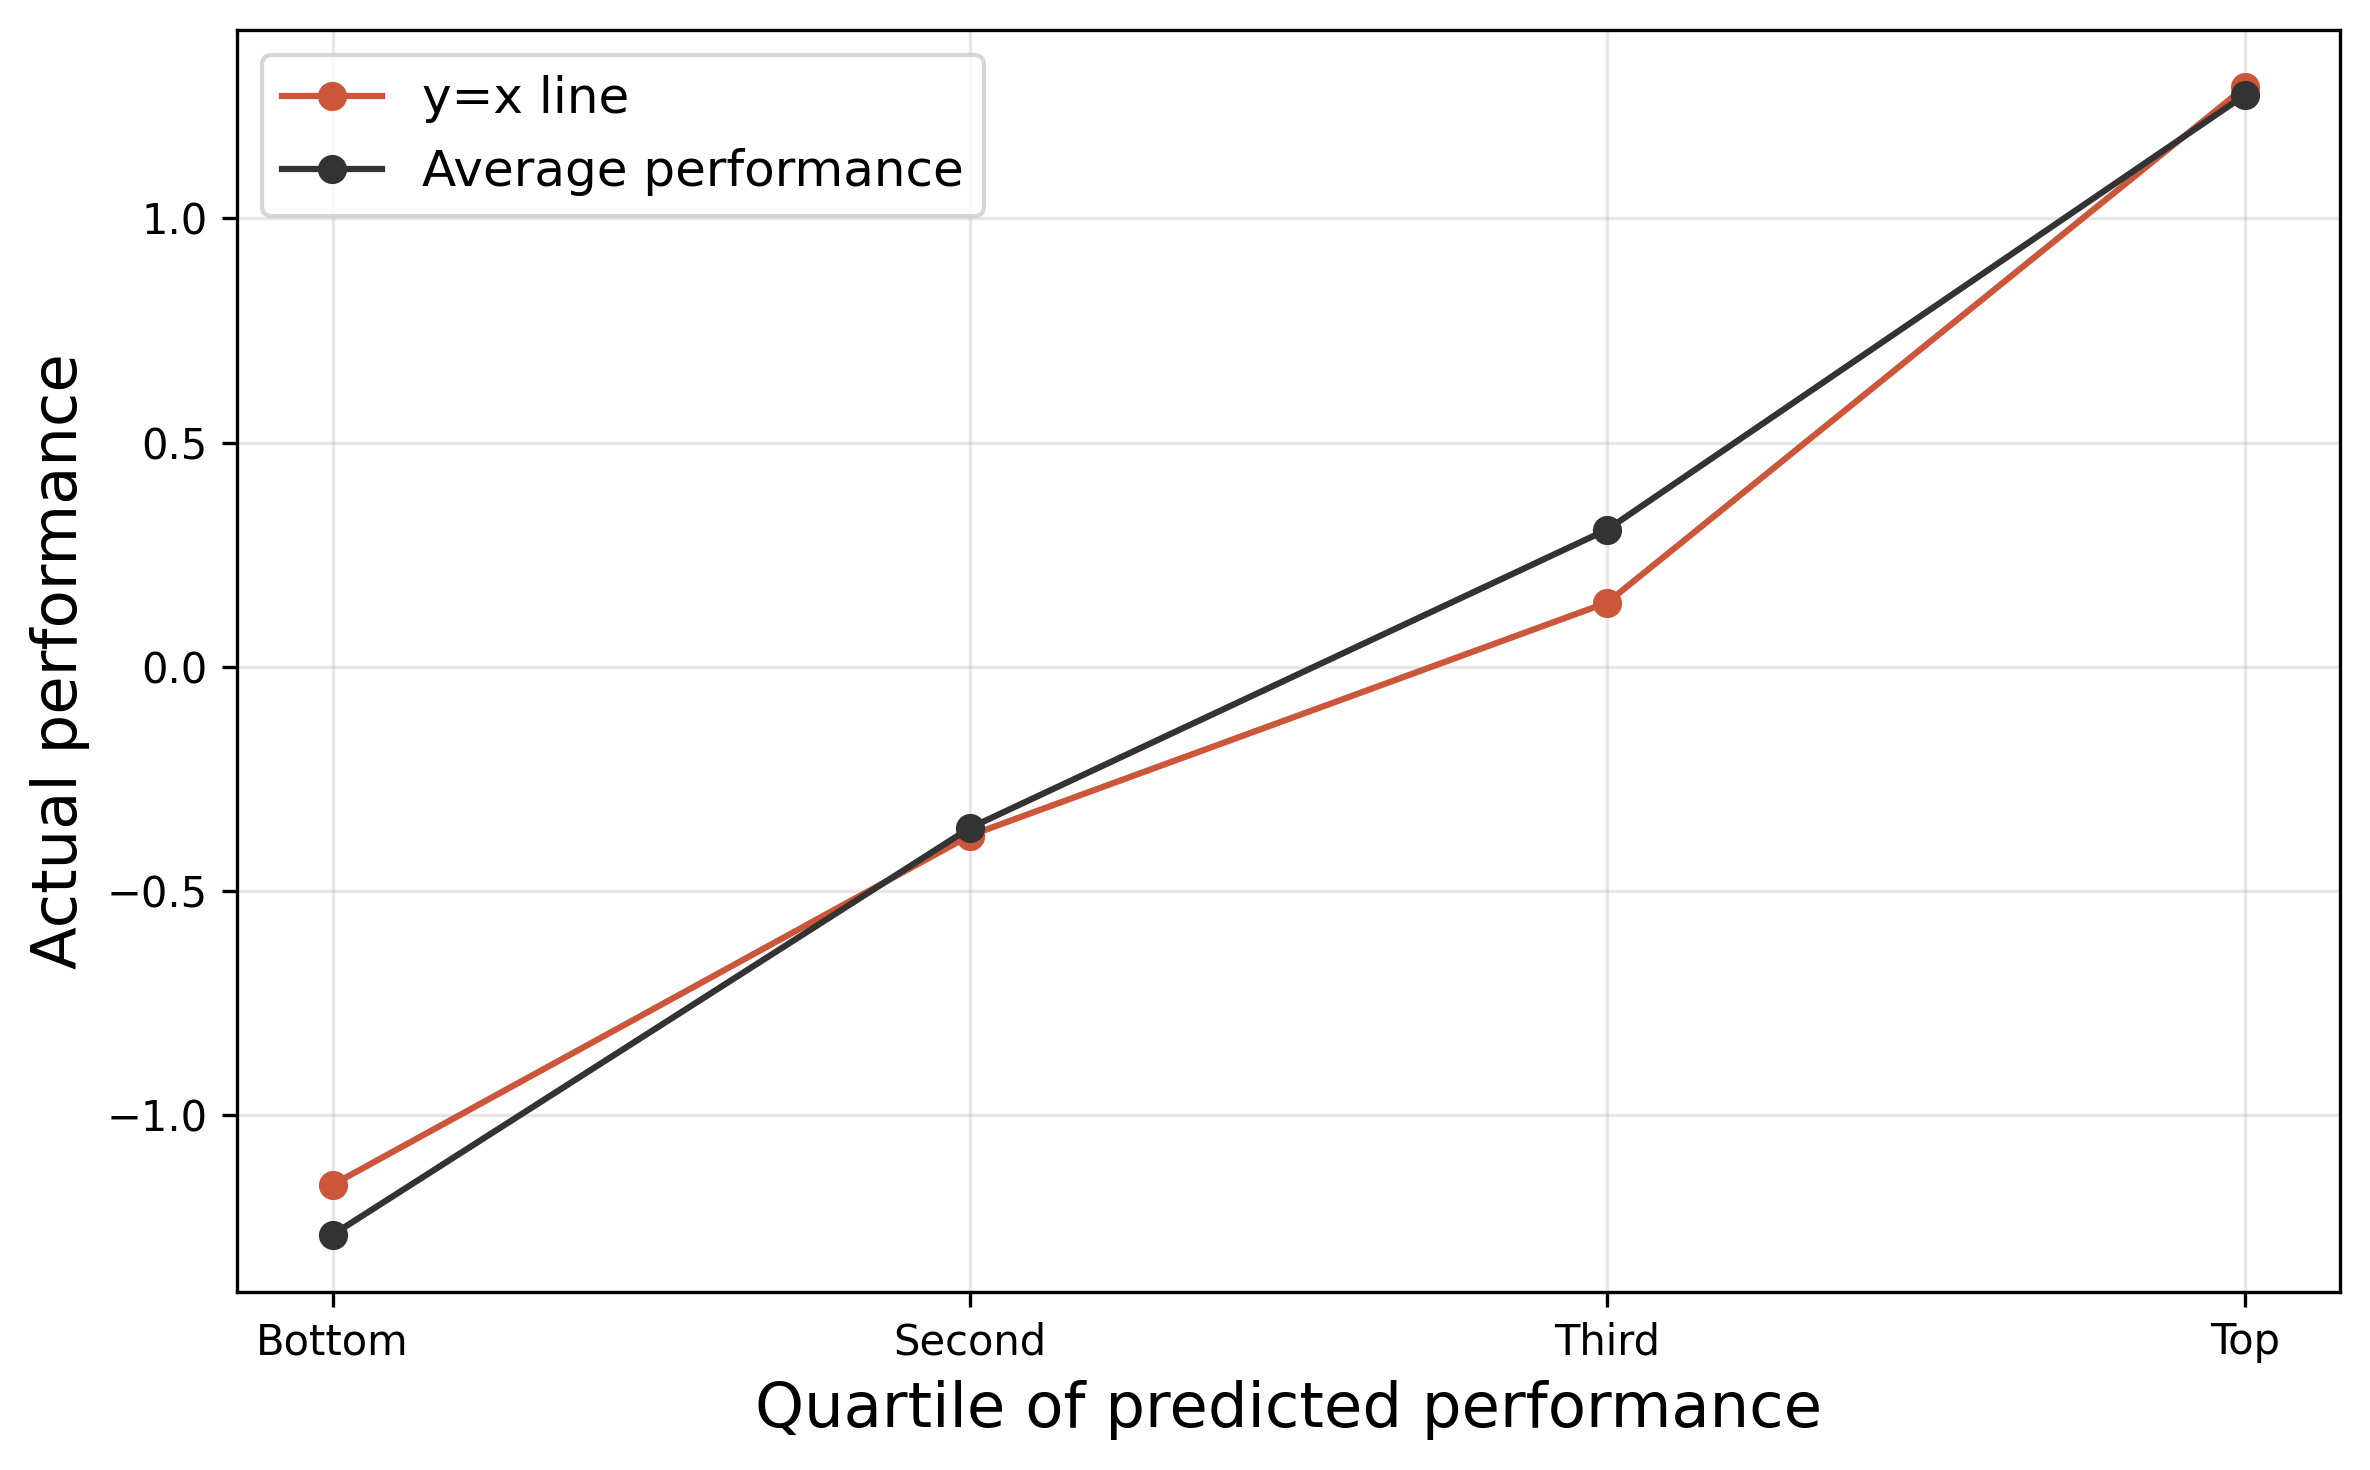
Figure 2: Here, we now bin our synthetic data — created using (\ref{model}) with \(m=1\) — by predicted performance and then plot actual performance against this. I.e., here we plot "\(y\) vs \(x\)" instead of "\(x\) vs \(y\)", revealing there is no bias in the predictions.
Conclusion
The original DK plot on its own does not provide evidence for a bias in human psychology. Further, careful follow ups have been done with mixed results — it is currently unclear whether the DK effect is real or general [3, 4].
References
[1] Kruger, J., & Dunning, D. (1999). "Unskilled and unaware of it: How difficulties in recognizing one's own incompetence lead to inflated self-assessments." Journal of Personality and Social Psychology, 77(6), 1121–1134.
[2] Krueger, J. I., & Mueller, R. A. (2002). "Unskilled, unaware, or both? The better-than-average heuristic and statistical regression predict errors in estimates of own performance." Journal of Personality and Social Psychology, 82(2), 180–188.
[3] Gignac, G. E., & Zajenkowski, M. (2020). "The Dunning-Kruger effect is (mostly) a statistical artefact: Valid approaches to testing the hypothesis with individual differences data." Intelligence, 80, 101449.
[4] Dunkel, C. S., Nedelec, J. L., & van der Linden, D. (2023). "Reevaluating the Dunning-Kruger effect: A response to and replication of Gignac and Zajenkowski (2020)." Intelligence, 96, 101717.